

This is part 4 of a series on OpenTelemetry, the previous parts include:
- Practical OpenTelemetry part 1: Python
- Practical OpenTelemetry part 2: Go
- Practical OpenTelemetry part 3: Java
Building on the first three parts, part four will configure your application to send data to another backend, Zipkin. I’ll be honest, changing backends is a pain. Each time I want to test a new backend, I have to:
- install the new exporter package
- update the code in every application that configures the exporter
- test the code to ensure each application is sending the data as expected to the backend
There just has to be a better way. You may be asking yourself: Is it possible to configure a single exporter to rule them all? The answer, yes, yes it is.
OpenTelemetry Collector
Thankfully the collector can help us here. The OpenTelemetry Collector is an application that can receive telemetry in various different formats via configurable endpoints called receivers. The collector can then be configured to output data to any number of backends.
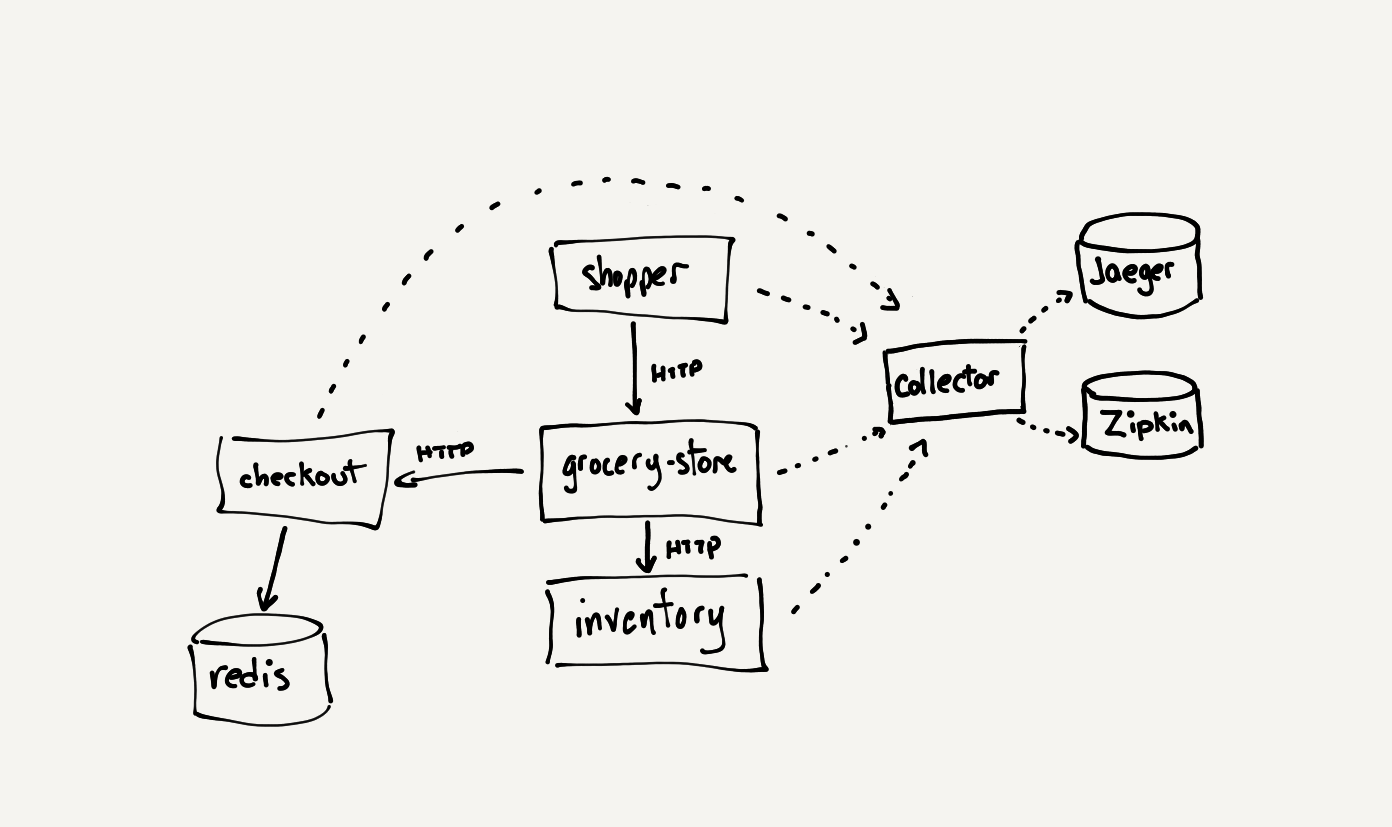
There are many aspects of the collector that will not be covered in this article, here we are mainly concerned with its ability to receive a single input and output to different backends. This will demonstrate the flexibility provided by the collector. Let’s get started by launching the backends we will send data do from the collector: Zipkin and Jaeger. As we did previously with Jaeger, we’ll be using Docker to accomplish this. It’s important to note that in the docker command to start Jaeger, we’ve changed the port number from 6831 to 16831 as port 6831 will be used by the OpenTelemetry Collector. This will prevent us from having to change any of the applications from the previous articles.
1
2
3
4
5
6
7
8
9
10
docker run -d --name jaeger \
  -p 5775:5775/udp \
  -p 16831:6831/udp \
  -p 6832:6832/udp \
  -p 5778:5778 \
  -p 16686:16686 \
  -p 14268:14268 \
  -p 14250:14250 \
  jaegertracing/all-in-one:1.21
docker run -d -p 9411:9411 openzipkin/zipkin
Browse to http://localhost:9411 and http://localhost:16686 to confirm both backends are up and running. Next let’s download the OpenTelemetry Collector binary from the releases page. The collector is also avialable to download as a Docker image, but for the sake of simplicity, I wanted to leave docker networking out of the equation. If you choose to download the binary, you’ll have to select the correct package for your environment, I’m running on a Mac with an Intel processor so the following command will work for me.
1
wget -O otel-collector https://github.com/open-telemetry/opentelemetry-collector/releases/download/v0.27.0/otelcol_darwin_amd64
Let’s update the permissions on the collector binary and run the command, hoping to get a helpful error message here:
1
2
3
4
5
6
7
8
chmod +x ./otel-collector
./otel-collector
2021-05-26T23:04:07.513-0700	info	service/application.go:277	Starting otelcol...	{"Version": "v0.27.0", "NumCPU": 16}
2021-05-26T23:04:07.513-0700	info	service/application.go:185	Setting up own telemetry...
2021-05-26T23:04:07.520-0700	info	service/telemetry.go:98	Serving Prometheus metrics	{"address": ":8888", "level": 0, "service.instance.id": "0af3241b-a5a8-4c52-a13f-f702d0b89a8c"}
2021-05-26T23:04:07.520-0700	info	service/application.go:220	Loading configuration...
Error: cannot load configuration's parser: config file not specified
2021/05/26 23:04:07 application run finished with error: cannot load configuration's parser: config file not specified
Awesome, so far so good. Now the real fun starts with YAML. We need to configure the collector to setup the Jaeger receiver, as this is what our applications are currently exporting. We will also setup two exporters from the collector, to send data to both Jaeger and Zipkin, our configuration will look like this:
1
2
3
4
5
6
7
8
9
10
11
12
13
14
15
16
receivers:
  jaeger:
    protocols:
      thrift_compact:
exporters:
  jaeger:
    endpoint: localhost:14250
    insecure: true
  zipkin:
    endpoint: http://localhost:9411/api/v2/spans
    format: proto
service:
  pipelines:
    traces:
      receivers: [jaeger]
      exporters: [zipkin, jaeger]
Running the collector with this configuration should yield better results than previously.
1
2
3
4
5
6
7
8
./otel-collector --config collector.yaml
2021-05-26T23:21:58.093-0700	info	service/application.go:277	Starting otelcol...	{"Version": "v0.27.0", "NumCPU": 16}
2021-05-26T23:21:58.094-0700	info	service/application.go:185	Setting up own telemetry...
2021-05-26T23:21:58.098-0700	info	service/telemetry.go:98	Serving Prometheus metrics	{"address": ":8888", "level": 0, "service.instance.id": "bc300367-3aeb-4e12-93d0-9a3a5fece253"}
2021-05-26T23:21:58.098-0700	info	service/application.go:220	Loading configuration...
2021-05-26T23:21:58.101-0700	info	service/application.go:236	Applying configuration...
2021-05-26T23:21:58.102-0700	info	builder/exporters_builder.go:274	Exporter was built.	{"kind": "exporter", "exporter": "zipkin"}
...
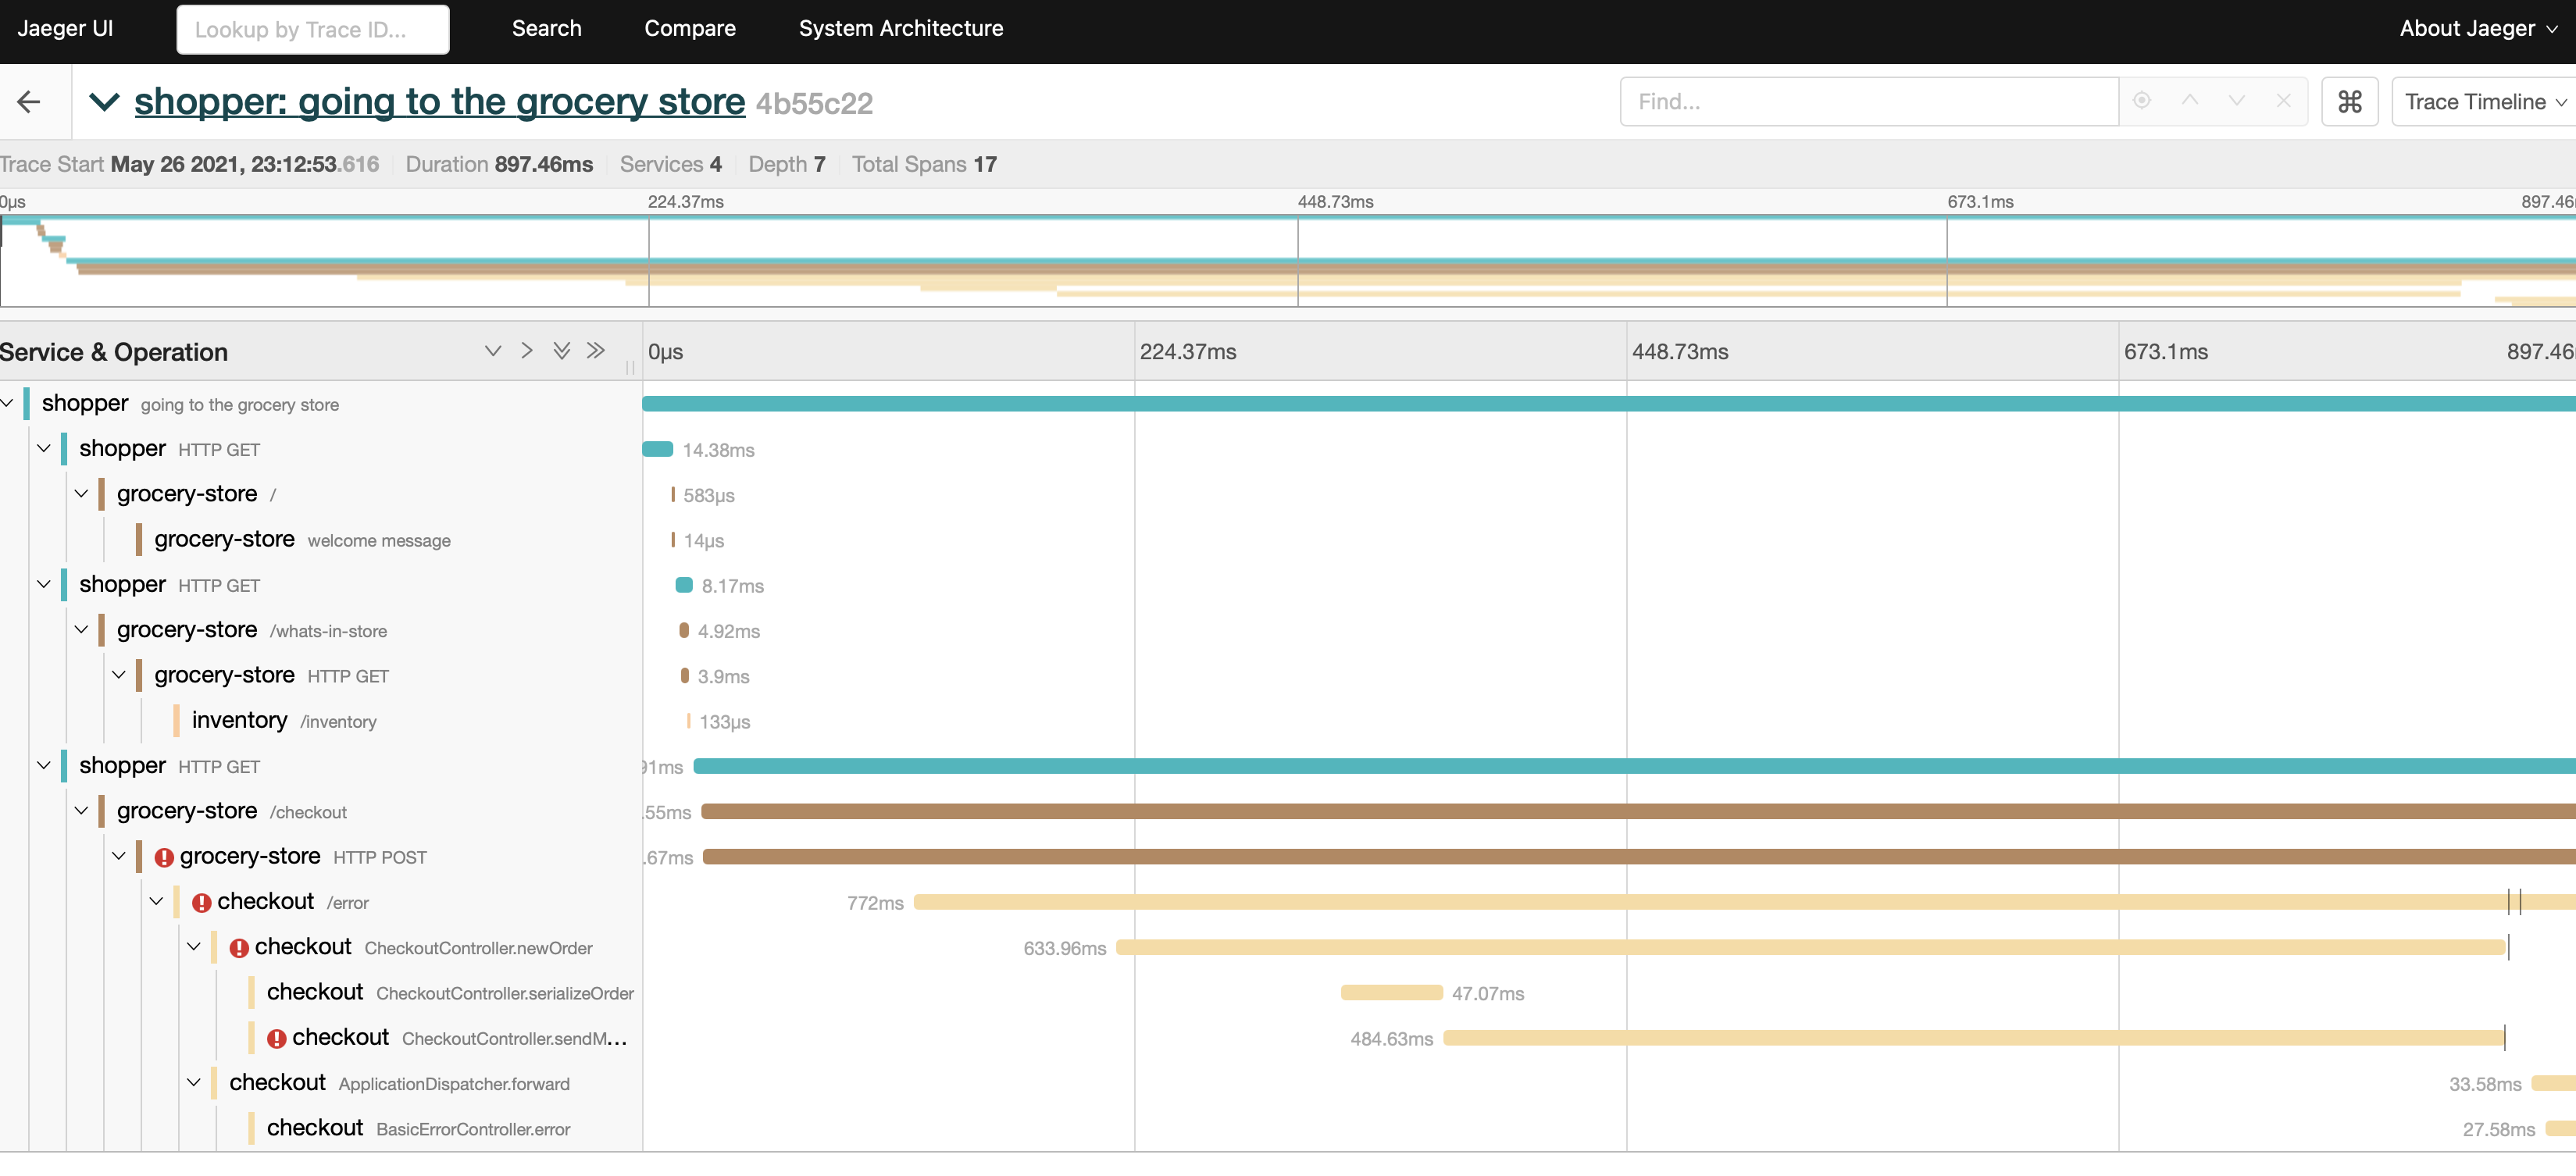
The collector and backends now in place, it’s finally time for the fun stuff. Running the shopper, grocery store, inventory and checkout applications from the previous articles, we expect the telemetry to go to the collector, then have the collector pass the data on to Zipkin and Jaeger for us. Let’s take a look at the familiar Jaeger UI first:
Now we search for the same trace in Zipkin:
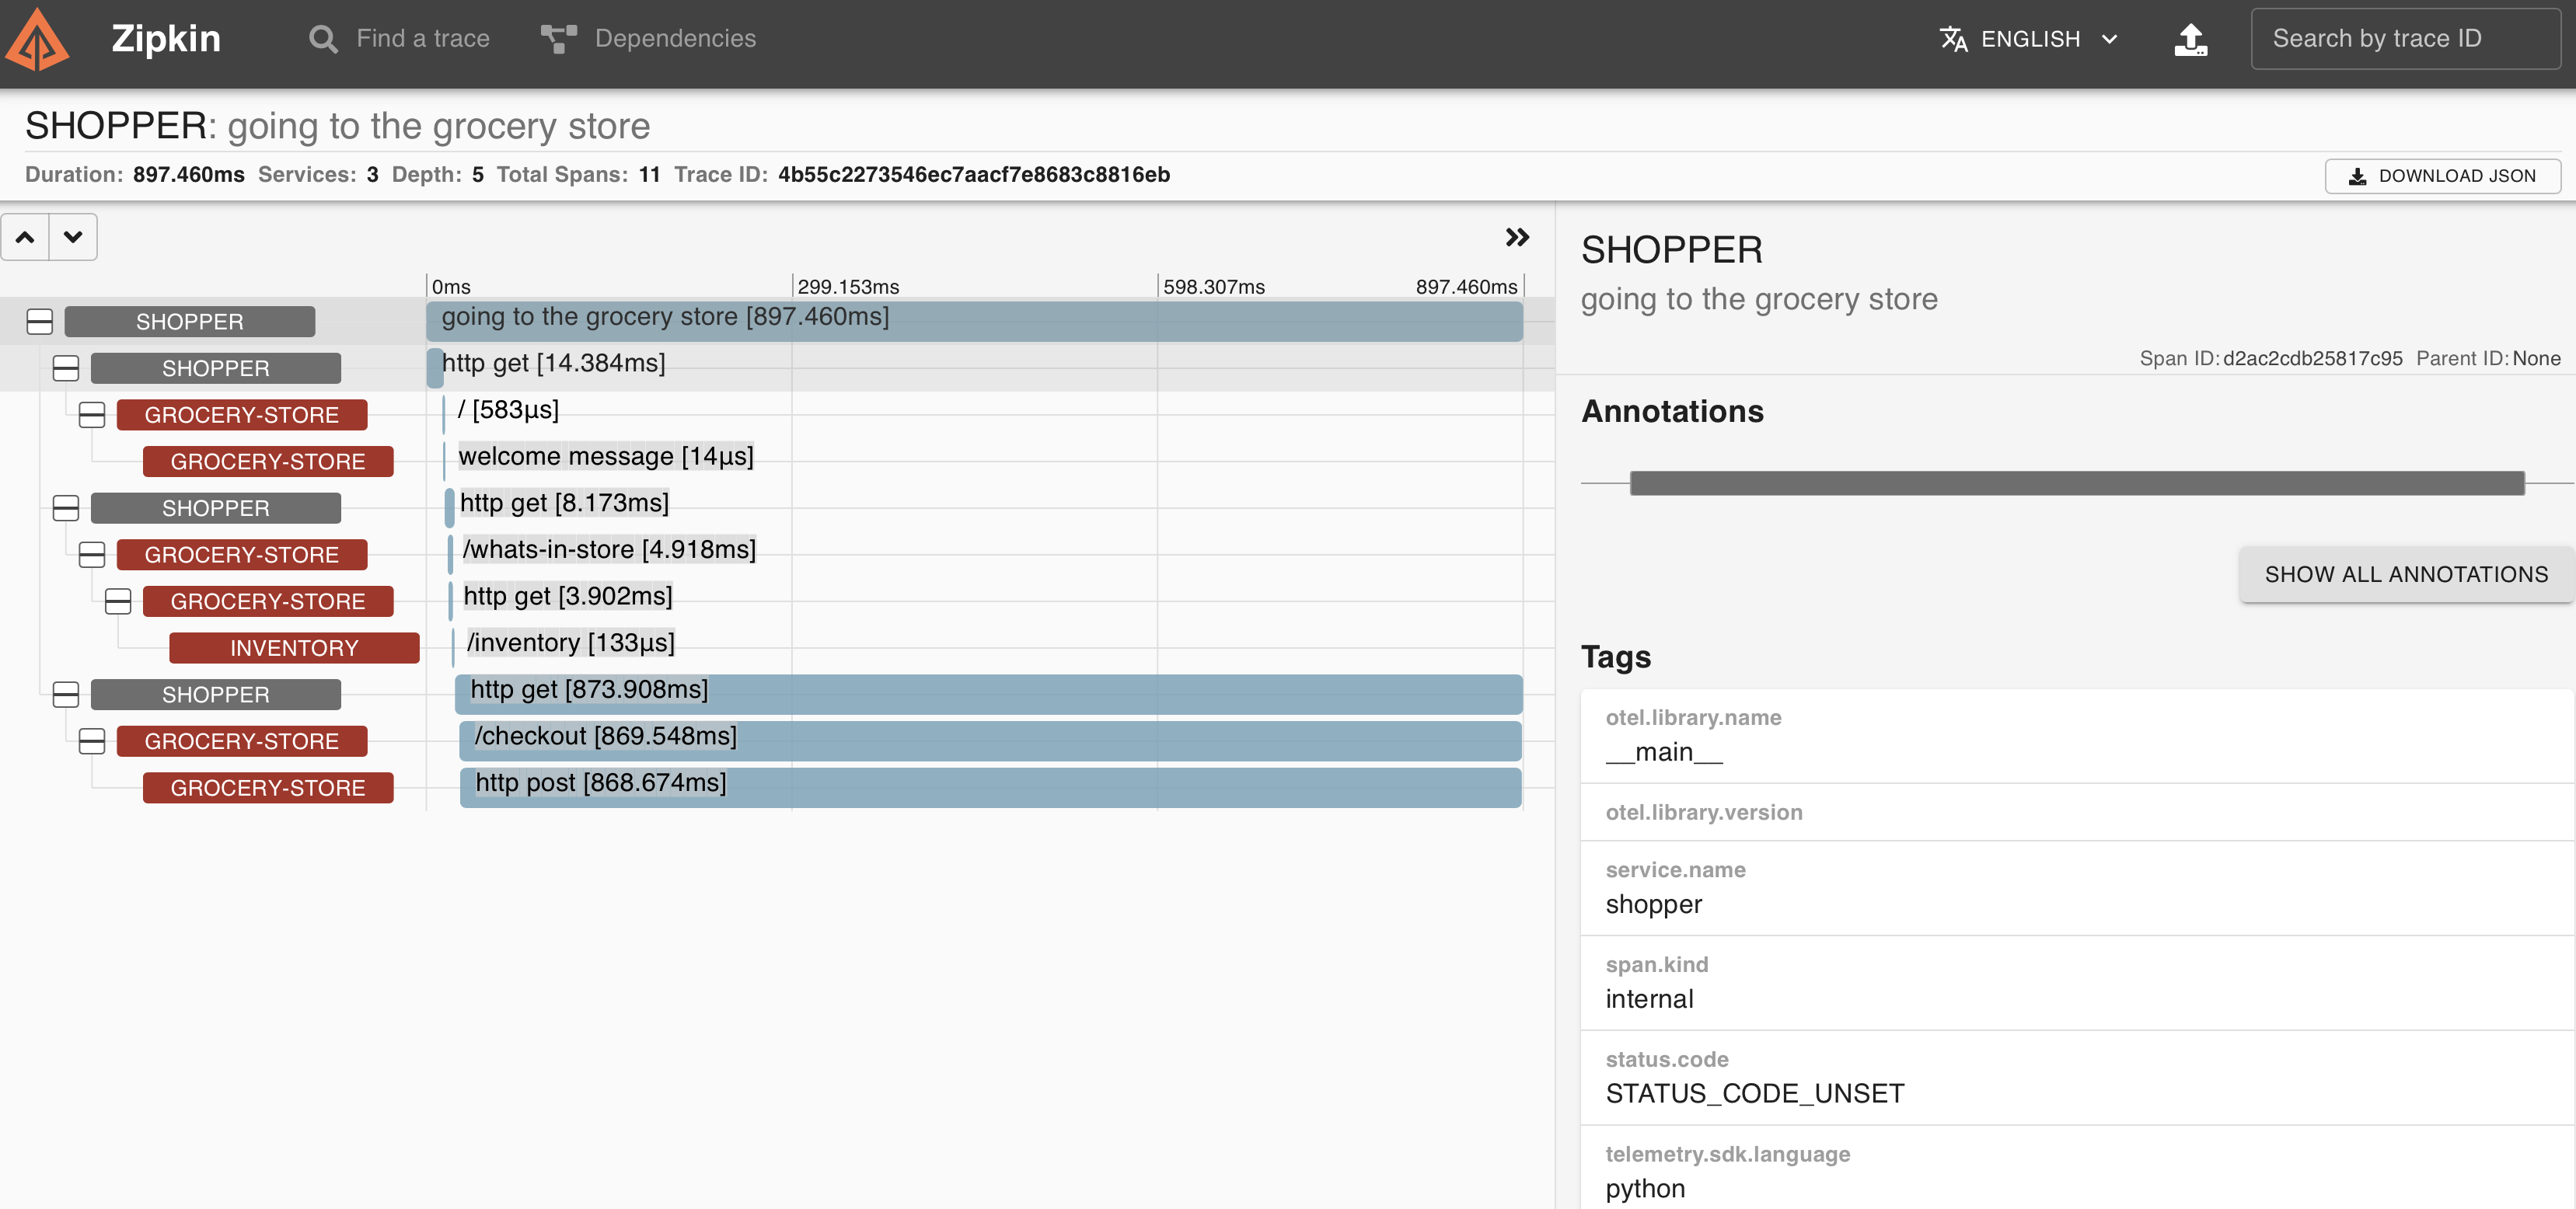
Awesome! It looks like both backends received the data from the collector. This is pretty exciting if you’re wanting to try different backends or vendors with little effort.
Debugging issues
It’s helpful to note that when first settings things up, it’s really helpful to enable logging in the collector to see if data is coming in at all. This can be done by enabling the logging exporter with a debug log level as per the following configuration:
1
2
3
4
5
6
7
exporters:
  logging:
    loglevel: debug
service:
  pipelines:
    traces:
      exporters: [logging]
The output from the collector with this exporter configured will then show us all the telemetry processed by the collector in a format similar to this:
1
2
3
4
5
6
7
8
9
10
11
12
13
14
15
16
17
18
19
20
21
Resource labels:
     -> service.name: STRING(grocery-store)
InstrumentationLibrarySpans #0
InstrumentationLibrary
Span #0
    Trace ID       : 3a2e86c4d30c0a8aa3af57526550d0ec
    Parent ID      : 1ff6d44e92698b45
    ID             : 81a05154a4702b0d
    Name           : welcome message
    Kind           : SPAN_KIND_INTERNAL
    Start time     : 2021-05-27 06:29:34.294704 +0000 UTC
    End time       : 2021-05-27 06:29:34.294717 +0000 UTC
    Status code    : STATUS_CODE_UNSET
    Status message :
Attributes:
     -> telemetry.sdk.language: STRING(python)
     -> telemetry.sdk.name: STRING(opentelemetry)
     -> telemetry.sdk.version: STRING(1.0.0rc1)
     -> service.name: STRING(grocery-store)
     -> otel.library.version: STRING()
     -> otel.library.name: STRING(__main__)
With all of this in place, we can feel free to test out different telemetry backends to our hearts’ content without ever feeling the pressure of vendor lock-in! The OpenTelemetry Collector is so much more than is covered in this article, please take a look at the collector repository and the OpenTelemetry website for additional information. The configuration for this article can be found alongside the code for all previous parts in (GitHub](https://github.com/codeboten/practical-otel).
Photo by Gabriel Griego on Unsplash
