

NOTE: This example code for this article has been updated with 1.3.0
The OpenTelemetry project delivered an important milestone in February 2021, the specification for the tracing API and SDK reached 1.0.0! Soon after, several implementations have shipped 1.0.0 release candidates builds. To celebrate, I decided to put together a series of tutorials on different components and implementations of the project. As .Net, Python and Java were the first implementations to get out of the door, I thought why not start with a tutorial for Python.
Throughout the series, we’ll build a series of services that will combine together to create a distributed system. We’ll explore setting up different backends to visualize our data and configure the collector as well. Since the specification for the metrics and logging APIs are still being developed, we’ll focus on the tracing side of things.
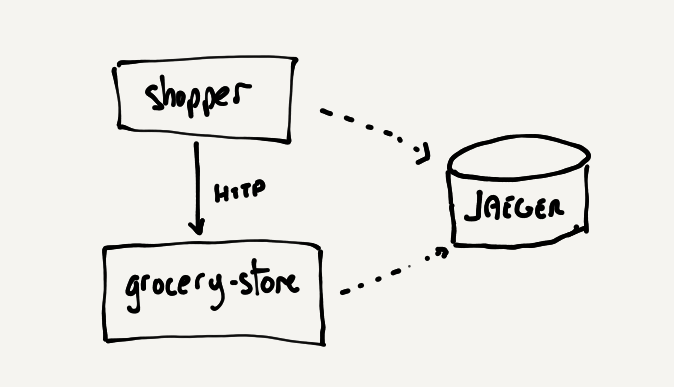
The project we’ll be building is a grocery store. We’ll use different languages to build out different components of the store. As the project progresses, we’ll add components to our diagram, but for today, we’ll start with an API server, and a client.
Getting started
Before starting with OpenTelemetry for Python, I recommend setting up a virtual environment.
1
2
python3 -m venv grocery_store
source ./grocery_store/bin/activate
Next we’ll install the OpenTelemetry packages. In the Python implementation, there is an API and a SDK package that we’ll need. For the sake of this demo, we will start outputting our tracing information to the terminal, then use Jaeger as a backend. Later on, we’ll setup the OpenTelemetry collector which will give us more flexibility. The client will use the Requests library to send HTTP requests to the API, which will be implemented using Flask.
1
pip install requests flask
1
2
3
4
5
6
#!/usr/bin/env python3
# shopper.py
import requests

res = requests.get("http://localhost:5000")
print(res.text)
1
2
3
4
5
6
7
8
9
10
11
#!/usr/bin/env python3
# grocery_store.py
from flask import Flask

app = Flask(__name__)


@app.route("/")
def welcome():
    return "Welcome to the grocery store!"
Now let’s run the server:
1
2
chmod +x grocery_store.py
./grocery_store.py
In a different terminal, run the client. If all went according to plan, you should see a welcome message appear:
1
2
3
chmod +x shopper.py
./shopper.py
Welcome to the grocery store!
Adding tracing
So far so good! Now let’s get to OpenTelemetry! Install the following packages:
1
pip install opentelemetry-api opentelemetry-sdk
Next, let’s update the client and the server to include configuration for OpenTelemetry and start tracing. The TracerProvider allows us to obtain a tracer to create spans with. The BatchSpanProcessor will allow us to export spans once they’ve ended. Last but not least, the ConsoleSpanExporter will output our tracing data to the terminal.
1
2
3
4
5
6
7
8
9
from opentelemetry import trace
from opentelemetry.sdk.trace import TracerProvider
from opentelemetry.sdk.trace.export import BatchSpanProcessor, ConsoleSpanExporter

exporter = ConsoleSpanExporter() # will output tracing information to the terminal
provider = TracerProvider() # the SDK tracer provider allows us to get a tracer
span_processor = BatchSpanProcessor(exporter) # batches exports of spans once they've ended
provider.add_span_processor(span_processor)
trace.set_tracer_provider(provider)
Once we have the configuration in place, let’s get a tracer and start a span to trace an operation! To obtain a tracer, we’ll call get_tracer with a name for our tracer. To start a span, we’ll call start_as_current_span with a name for our operation. This method can be called within a context manager to automatically end the span once the context is exited
1
2
with trace.get_tracer(__name__).start_as_current_span("operation name"):
  # do some stuff
The code for our applications now looks like this:
1
2
3
4
5
6
7
8
9
10
11
12
13
14
15
16
17
18
19
20
21
22
23
24
#!/usr/bin/env python3
# grocery_store_server.py
from flask import Flask
from opentelemetry import trace
from opentelemetry.sdk.trace import TracerProvider
from opentelemetry.sdk.trace.export import BatchSpanProcessor, ConsoleSpanExporter


exporter = ConsoleSpanExporter()
provider = TracerProvider()
span_processor = BatchSpanProcessor(exporter)
provider.add_span_processor(span_processor)
trace.set_tracer_provider(provider)
app = Flask(__name__)


@app.route("/")
def welcome():
    with trace.get_tracer(__name__).start_as_current_span("welcome message"):
        return "Welcome to the grocery store!"


if __name__ == "__main__":
    app.run()
1
2
3
4
5
6
7
8
9
10
11
12
13
14
15
16
#!/usr/bin/env python3
# grocery_store_client.py
import requests
from opentelemetry import trace
from opentelemetry.sdk.trace import TracerProvider
from opentelemetry.sdk.trace.export import BatchSpanProcessor, ConsoleSpanExporter

exporter = ConsoleSpanExporter()
provider = TracerProvider()
span_processor = BatchSpanProcessor(exporter)
provider.add_span_processor(span_processor)
trace.set_tracer_provider(provider)

with trace.get_tracer(__name__).start_as_current_span("going to the grocery store"):
    res = requests.get("http://localhost:5000")
    print(res.text)
Now let’s run the server and client again. This time, we’ll should see some tracing information being printed out to the terminal:
1
2
3
4
5
6
7
8
9
10
11
12
13
14
15
16
17
18
19
20
21
22
23
24
25
26
./shopper.py
Welcome to the grocery store!
{
    "name": "going to the grocery store",
    "context": {
        "trace_id": "0x7a68362949f70d15eb9a10fd8206b73c",
        "span_id": "0x864a926b0a65f0d4",
        "trace_state": "[]"
    },
    "kind": "SpanKind.INTERNAL",
    "parent_id": null,
    "start_time": "2021-02-22T03:19:28.851078Z",
    "end_time": "2021-02-22T03:19:28.862019Z",
    "status": {
        "status_code": "UNSET"
    },
    "attributes": {},
    "events": [],
    "links": [],
    "resource": {
        "telemetry.sdk.language": "python",
        "telemetry.sdk.name": "opentelemetry",
        "telemetry.sdk.version": "1.0.0rc1",
        "service.name": "unknown_service"
    }
}
From the tracing information, we can see the name of our span, as well as the resources that are automatically configured by the SDK, informing us of the SDK used and automatically setting a default service.name attribute. On the server side, we’ll see similar data:
1
2
3
4
5
6
7
8
9
10
11
12
13
14
15
16
17
18
19
20
21
22
23
24
{
    "name": "welcome message",
    "context": {
        "trace_id": "0xf0e25dada760fe1887d77fa553c03a7b",
        "span_id": "0x2dd50d7157a32592",
        "trace_state": "[]"
    },
    "kind": "SpanKind.INTERNAL",
    "parent_id": null,
    "start_time": "2021-02-22T03:19:28.860836Z",
    "end_time": "2021-02-22T03:19:28.860855Z",
    "status": {
        "status_code": "UNSET"
    },
    "attributes": {},
    "events": [],
    "links": [],
    "resource": {
        "telemetry.sdk.language": "python",
        "telemetry.sdk.name": "opentelemetry",
        "telemetry.sdk.version": "1.0.0rc1",
        "service.name": "unknown_service"
    }
}
Now unknown_service is not super useful to identify our services, so let’s update that by creating a Resource that we’ll pass to the TracerProvider we configured in the code above. Set the service.name to shopper in shopper.py and to grocery-store in grocery_store.py:
1
2
3
4
5
6
...
from opentelemetry.sdk.resources import Resource

resource = Resource.create({"service.name": "shopper"})
provider = TracerProvider(resource=resource)
...
Run the commands again and the resource on our traces are updated to include more meaningful information
1
2
3
4
5
6
    "resource": {
        "telemetry.sdk.language": "python",
        "telemetry.sdk.name": "opentelemetry",
        "telemetry.sdk.version": "1.0.0rc1",
        "service.name": "shopper"
    }
More please
So far, we have configured OpenTelemetry and manually instrumented a single span in two separate applications, we could go on and implented more operations or add additional information about each operation, but some of that work is already done for us. Introducing, instrumentation libraries! Many implementations of OpenTelemetry have support for popular frameworks and libraries in their respective languages, Python is no different. For our example, we’ll use the flask and requests instrumentation libraries:
1
 pip install opentelemetry-instrumentation-flask opentelemetry-instrumentation-requests
Then we’ll need to use the instrumentation libraries in our code, each library implements various hooks or method wrappers to automatically instrument the underlying library. For more information about how instrumentation is implemented in OpenTelemetry, check out this Kubecon talk Carlos Cortez and I presented last year. In the following code, we’re importing the FlaskInstrumentor and RequestsInstrumentor, then calling instrument_app for flask and instrument for requests.
1
2
3
4
5
6
7
8
9
10
11
12
13
14
15
16
17
18
19
20
21
22
23
24
25
26
#!/usr/bin/env python3
# grocery_store.py
from flask import Flask
from opentelemetry import trace
from opentelemetry.sdk.trace import TracerProvider
from opentelemetry.sdk.trace.export import BatchSpanProcessor, ConsoleSpanExporter
from opentelemetry.instrumentation.flask import FlaskInstrumentor

exporter = ConsoleSpanExporter()
provider = TracerProvider(
    active_span_processor=BatchSpanProcessor(ConsoleSpanExporter())
)
trace.set_tracer_provider(provider)

app = Flask(__name__)
FlaskInstrumentor().instrument_app(app)


@app.route("/")
def welcome():
    with trace.get_tracer(__name__).start_as_current_span("welcome message"):
        return "Welcome to the grocery store!"


if __name__ == "__main__":
    app.run()
1
2
3
4
5
6
7
8
9
10
11
12
13
14
15
16
17
18
#!/usr/bin/env python3
# shopper.py
import requests
from opentelemetry import trace
from opentelemetry.sdk.trace import TracerProvider
from opentelemetry.sdk.trace.export import BatchSpanProcessor, ConsoleSpanExporter
from opentelemetry.instrumentation.requests import RequestsInstrumentor

exporter = ConsoleSpanExporter()
provider = TracerProvider(
    active_span_processor=BatchSpanProcessor(ConsoleSpanExporter())
)
trace.set_tracer_provider(provider)

RequestsInstrumentor().instrument()
with trace.get_tracer(__name__).start_as_current_span("going to the grocery store"):
    res = requests.get("http://localhost:5000")
    print(res.text)
With the libraries instrumented, we can run the applications one more time, and we should see quite a bite more tracing information:
1
2
3
4
5
6
7
8
9
10
11
12
13
14
15
16
17
18
19
20
21
22
23
24
25
26
27
28
29
30
31
32
33
34
35
36
37
38
39
40
41
42
43
44
45
46
47
48
49
50
51
52
53
54
55
56
57
58
59
60
61
62
63
64
65
66
67
68
69
70
71
72
73
74
75
76
77
78
79
80
81
82
83
84
85
86
87
88
89
90
91
92
93
94
95
96
97
98
99
100
101
102
103
104
105
106
107
108
109
110
111
112
113
114
115
116
117
118
119
120
121
122
123
124
125
126
python grocery_store.py
 * Serving Flask app "grocery_store" (lazy loading)
 * Environment: production
   WARNING: This is a development server. Do not use it in a production deployment.
   Use a production WSGI server instead.
 * Debug mode: off
 * Running on http://127.0.0.1:5000/ (Press CTRL+C to quit)
127.0.0.1 - - [23/Feb/2021 22:08:47] "GET / HTTP/1.1" 200 -
{
    "name": "welcome message",
    "context": {
        "trace_id": "0x0553f17d0e50e717107d7cf360eaa6ae",
        "span_id": "0xba727dcb0fffe532",
        "trace_state": "[]"
    },
    "kind": "SpanKind.INTERNAL",
    "parent_id": "0x06bf88ce0267fd35",
    "start_time": "2021-02-24T06:08:47.221677Z",
    "end_time": "2021-02-24T06:08:47.221695Z",
    "status": {
        "status_code": "UNSET"
    },
    "attributes": {},
    "events": [],
    "links": [],
    "resource": {
        "telemetry.sdk.language": "python",
        "telemetry.sdk.name": "opentelemetry",
        "telemetry.sdk.version": "1.0.0rc1",
        "service.name": "grocery-store"
    }
}
{
    "name": "/",
    "context": {
        "trace_id": "0x0553f17d0e50e717107d7cf360eaa6ae",
        "span_id": "0x06bf88ce0267fd35",
        "trace_state": "[]"
    },
    "kind": "SpanKind.SERVER",
    "parent_id": "0x06b7c53dfc190a87",
    "start_time": "2021-02-24T06:08:47.220556Z",
    "end_time": "2021-02-24T06:08:47.221827Z",
    "status": {
        "status_code": "UNSET"
    },
    "attributes": {
        "http.method": "GET",
        "http.server_name": "127.0.0.1",
        "http.scheme": "http",
        "net.host.port": 5000,
        "http.host": "localhost:5000",
        "http.target": "/",
        "net.peer.ip": "127.0.0.1",
        "http.user_agent": "python-requests/2.25.1",
        "net.peer.port": 53696,
        "http.flavor": "1.1",
        "http.route": "/",
        "http.status_text": "OK",
        "http.status_code": 200
    },
    "events": [],
    "links": [],
    "resource": {
        "telemetry.sdk.language": "python",
        "telemetry.sdk.name": "opentelemetry",
        "telemetry.sdk.version": "1.0.0rc1",
        "service.name": "grocery-store"
    }
}
python shopper.py
Welcome to the grocery store!
{
    "name": "HTTP GET",
    "context": {
        "trace_id": "0x0553f17d0e50e717107d7cf360eaa6ae",
        "span_id": "0x06b7c53dfc190a87",
        "trace_state": "[]"
    },
    "kind": "SpanKind.CLIENT",
    "parent_id": "0x960fb5ed3c18985e",
    "start_time": "2021-02-24T06:08:47.212572Z",
    "end_time": "2021-02-24T06:08:47.222468Z",
    "status": {
        "status_code": "UNSET"
    },
    "attributes": {
        "http.method": "GET",
        "http.url": "http://localhost:5000",
        "http.status_code": 200,
        "http.status_text": "OK"
    },
    "events": [],
    "links": [],
    "resource": {
        "telemetry.sdk.language": "python",
        "telemetry.sdk.name": "opentelemetry",
        "telemetry.sdk.version": "1.0.0rc1",
        "service.name": "shopper"
    }
}
{
    "name": "going to the grocery store",
    "context": {
        "trace_id": "0x0553f17d0e50e717107d7cf360eaa6ae",
        "span_id": "0x960fb5ed3c18985e",
        "trace_state": "[]"
    },
    "kind": "SpanKind.INTERNAL",
    "parent_id": null,
    "start_time": "2021-02-24T06:08:47.212389Z",
    "end_time": "2021-02-24T06:08:47.222568Z",
    "status": {
        "status_code": "UNSET"
    },
    "attributes": {},
    "events": [],
    "links": [],
    "resource": {
        "telemetry.sdk.language": "python",
        "telemetry.sdk.name": "opentelemetry",
        "telemetry.sdk.version": "1.0.0rc1",
        "service.name": "shopper"
    }
}
Now that we have SO MUCH stuff in there! Both instrumentation libraries automatically insert new spans which include attributes based on a set of semantic conventions defined in the OpenTelemetry Specification.
Adding a backend
We now have some useful tracing information being emitted from the client and server, but the terminal is hardly a useful place to see this data. OpenTelemetry supports sending data to multiple backends via custom exporters. The project has official support for exporting to Zipkin, Jaeger and any backend that support the OpenTelemetry protocol (OTLP). In this next section, we’ll walk through configuring a Jaeger backend locally using Docker.
1
2
3
4
5
6
7
8
9
10
11
docker run -d --name jaeger \
  -e COLLECTOR_ZIPKIN_HTTP_PORT=9411 \
  -p 5775:5775/udp \
  -p 6831:6831/udp \
  -p 6832:6832/udp \
  -p 5778:5778 \
  -p 16686:16686 \
  -p 14268:14268 \
  -p 14250:14250 \
  -p 9411:9411 \
  jaegertracing/all-in-one:1.21
After running that Docker command, http://localhost:16686 will bring up the Jaeger user interface. Additional information for other setups can be found on the Jaeger website. Next, let’s install the OpenTelemetry Jaeger exporter package:
1
pip install opentelemetry-exporter-jaeger
And add a new SpanProcessor configured to use the JaegerExporter:
1
2
3
4
5
6
7
8
...
from opentelemetry.exporter.jaeger.thrift import JaegerExporter

provider.add_span_processor(
    BatchSpanProcessor(JaegerExporter("grocery-store"))
)
trace.set_tracer_provider(provider)
...
Now let’s run the client and server one last time. If everything went according to plan, we should be able to open up the Jaeger interface, search for one of our services and “Find Traces”:
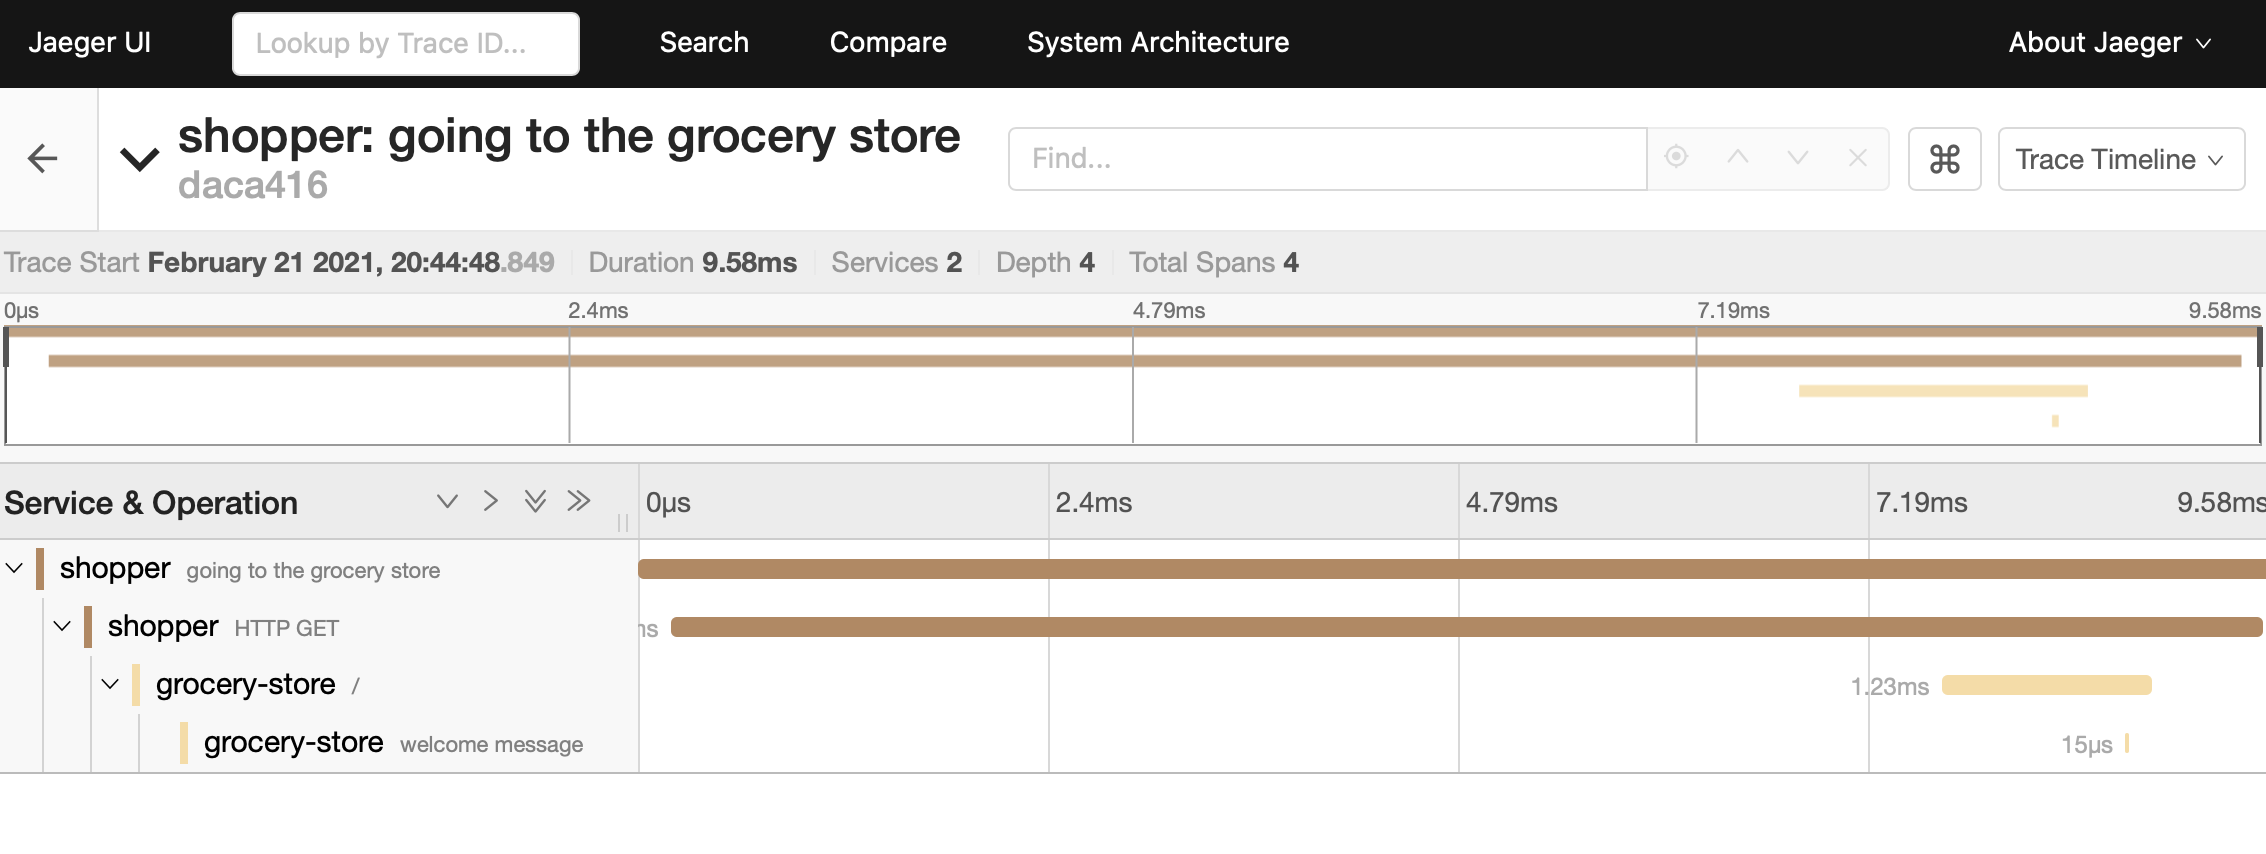
And that’s it for the first part of practical OpenTelemetry! We’ve configured the first components of our distributed system, as well as a backend to visualize the data. Next time, we’ll instrument another service and maybe throw in a database or two! All the code for this series can be found in this GitHub repo.
Cover Photo by Lamna The Shark on Unsplash
