
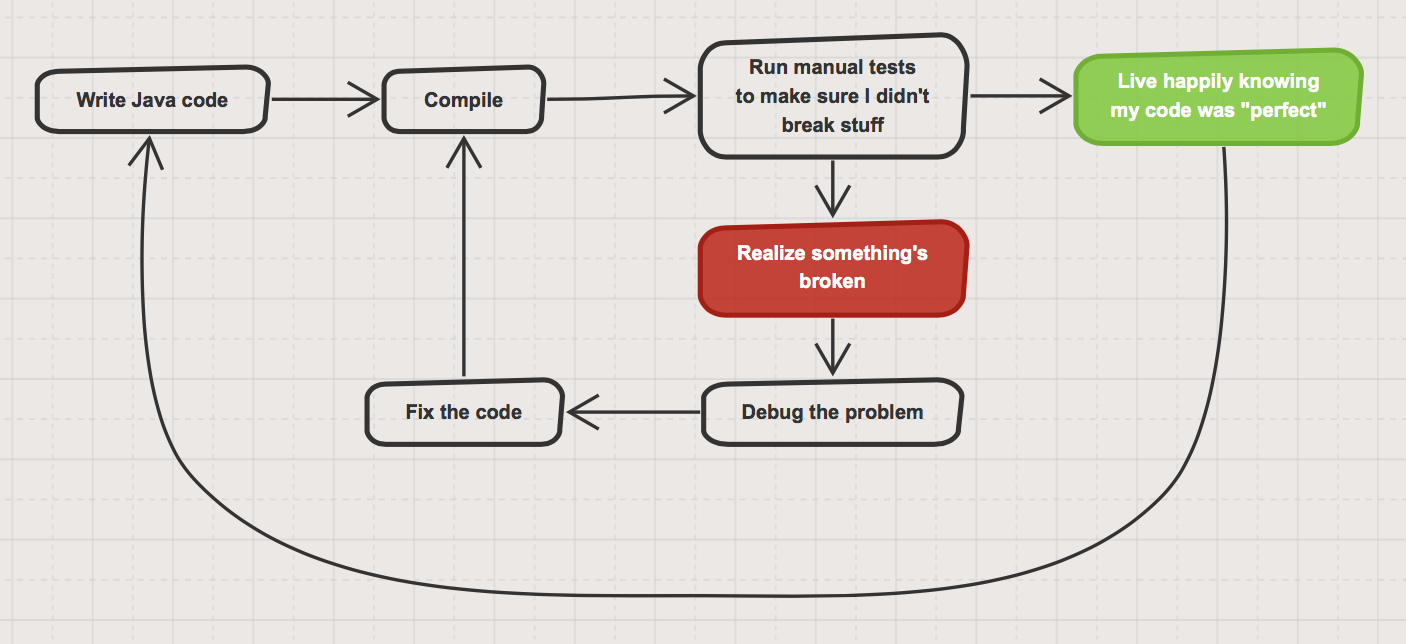
Years ago, this used to be my workflow:
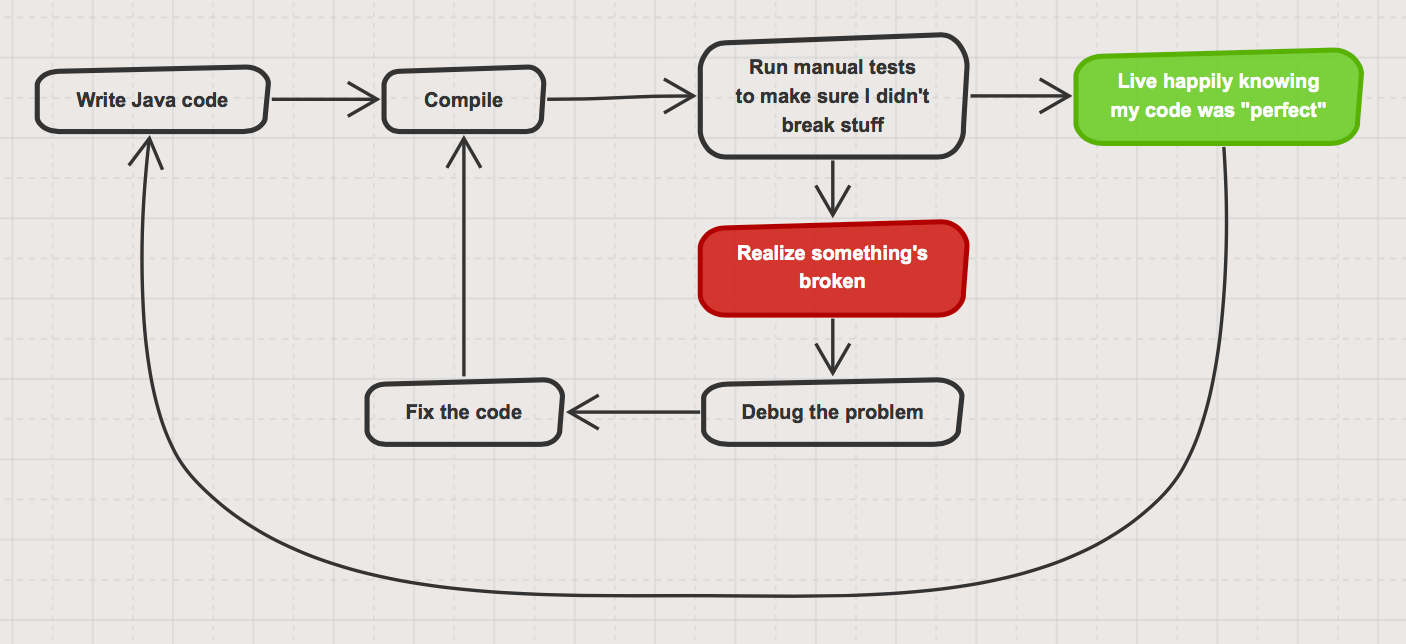
Of course there was a better way, I just didn’t know any better. A short time later, I was introduced to the better way: test-driven development (TDD). It turned my little world upside down. I could now write any amount of code, save the file I was working on and have a bunch of tests run immediately on the code I’d updated to tell me as soon as I’d foobar’d something. This became a cornerstone of development for me, the safety of having my tests run allowed me to get crazier with my code refactoring knowing that everything that used to work still did. I can’t even imagine the amount of time and stress TDD has saved me over the 10+ years I wrote code.
Fast forward to a few years ago, I joined the Quadra team at OpenDNS (now a part of Cisco) which built, deployed and operated the Platform-as-a-Service used by engineering to deploy applications into production. As we deployed to new datacenters to grow the platform’s footprint, a similar pattern to my earlier days in development started to emerge:
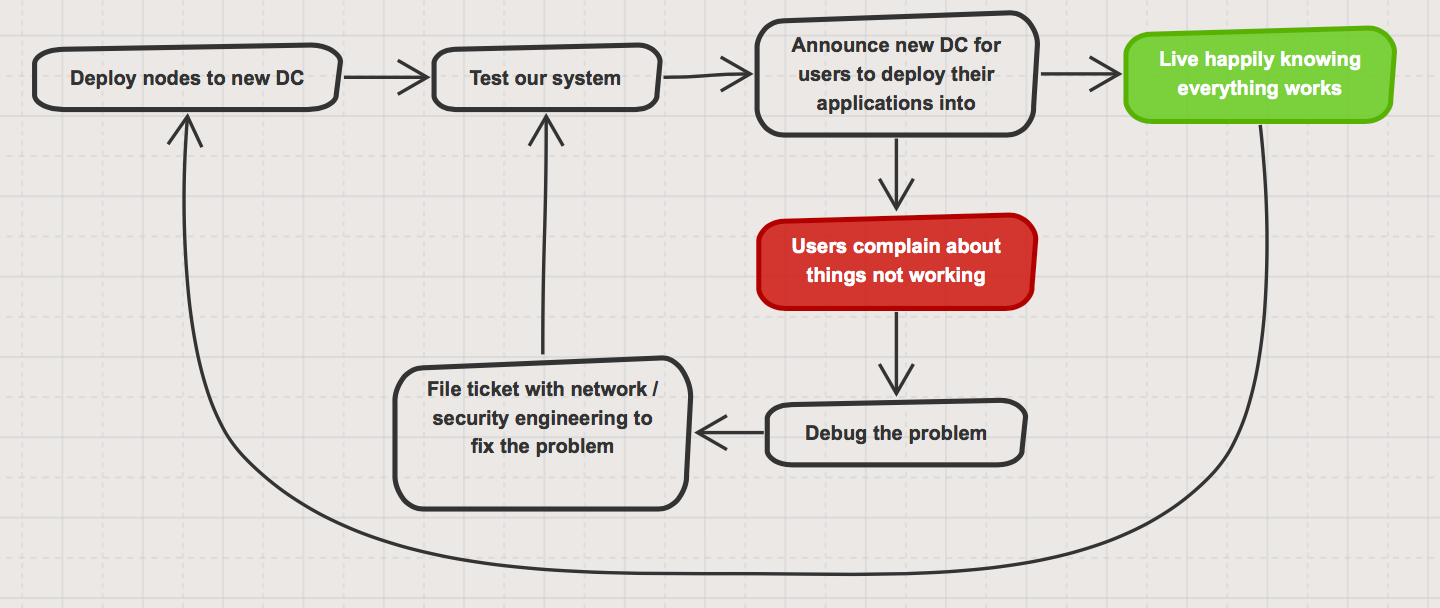
Of course the amount of time that was wasted during this process was significantly greater than the amount of time I was wasting on my own as it involved multiple teams, a ticketing system and often times multiple timezones, although, I’ll admit that I’ve wasted some significant amount of my development life chasing down trivial bugs I created… Nevertheless, there just had to be a better way.
Enters MDD
We continuously invest in automating our platform, whether it be deployment pipeline, fleet management or issue remediation. One of the rules of automating we try to follow is not to prematurely automate things that may never happen, which means that we need visibility into the different issues that arise and the frequency of their occurences. Using the data we collect from our various systems, we’ve built a thorough suite of Sensu monitors around our platform. We tried a few different tools when we originally set-up Quadra and decided to go with Sensu (http://sensuapp.org):
-
easy to deploy and configure the sensu server
-
adding clients just requires installing an agent and pointing it to the sensu server
-
a huge community existed around plugins and writing our own is simple
-
supports porting over existing nagios checks
As we found out operating the platform, Sensu is really good at telling us when things go wrong.

After deploying to a few datacenters, we realized that our systems tests and monitors weren’t good enough to catch issues at some key integration points with other infrastructure teams. We decided to start building monitors for those integration points, this led to Monitoring Driven Deployments (MDD). One of my favourite patterns of TDD is to write failing tests and see them turn green as the code gets written and the tests start to pass, the same pattern started happening with our deployments to new datacenters.
This allowed us to:
-
document the critical integration points for our users in a living document
-
easily visualize the state of the datacenter
-
gain visibility into any problem with those integration points during the operation of the platform
-
accelerate the process of deploying our PaaS to a new datacenter from what was a multi-day, even week(s), effort down to a matter of hours
-
and increase our engineers’ and users’ confidence that done was really done done
The best part of this has been to reduce the amount of toil and friction that this process used to create for the multiple teams involved.
