

The OpenTelemetry demo application version 1.4 was released in April of 2023. If you’re unfamiliar with the demo, it is comprised of many micro services written in various languages. The services are instrumented using OpenTelemetry and can be run in Kubernetes or in Docker using Docker Compose.
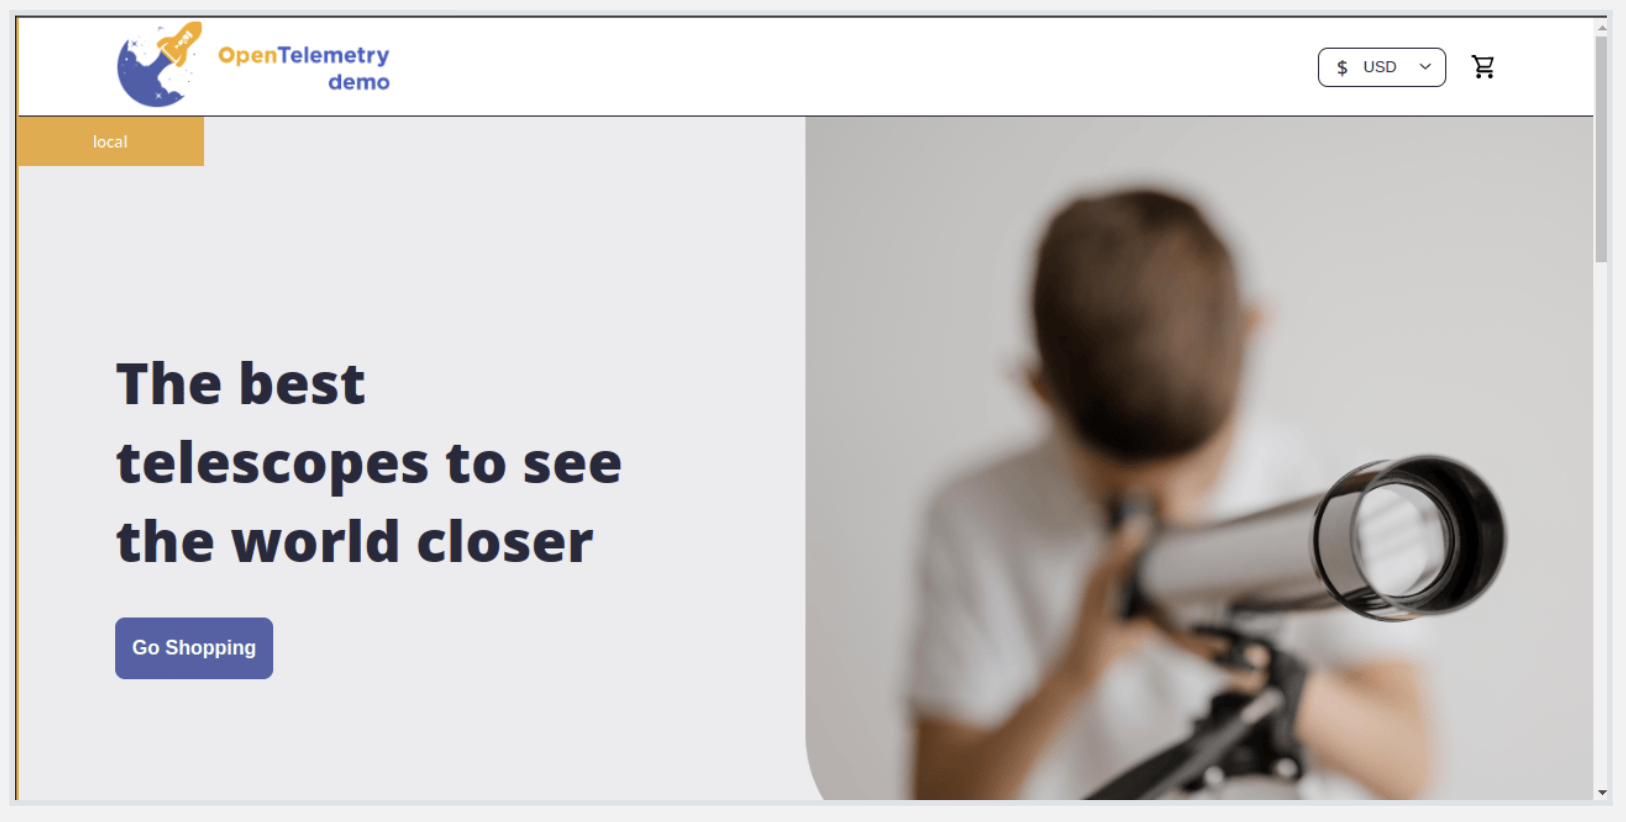
The main purpose of the demo app is to give people an idea of how OpenTelemetry can be used in a near real world scenario. It provides a starting point for folks looking for example code to get started in different languages. The telemetry generated by the demo also gives a sense to those who’ve not used OpenTelemetry before of what to expect.
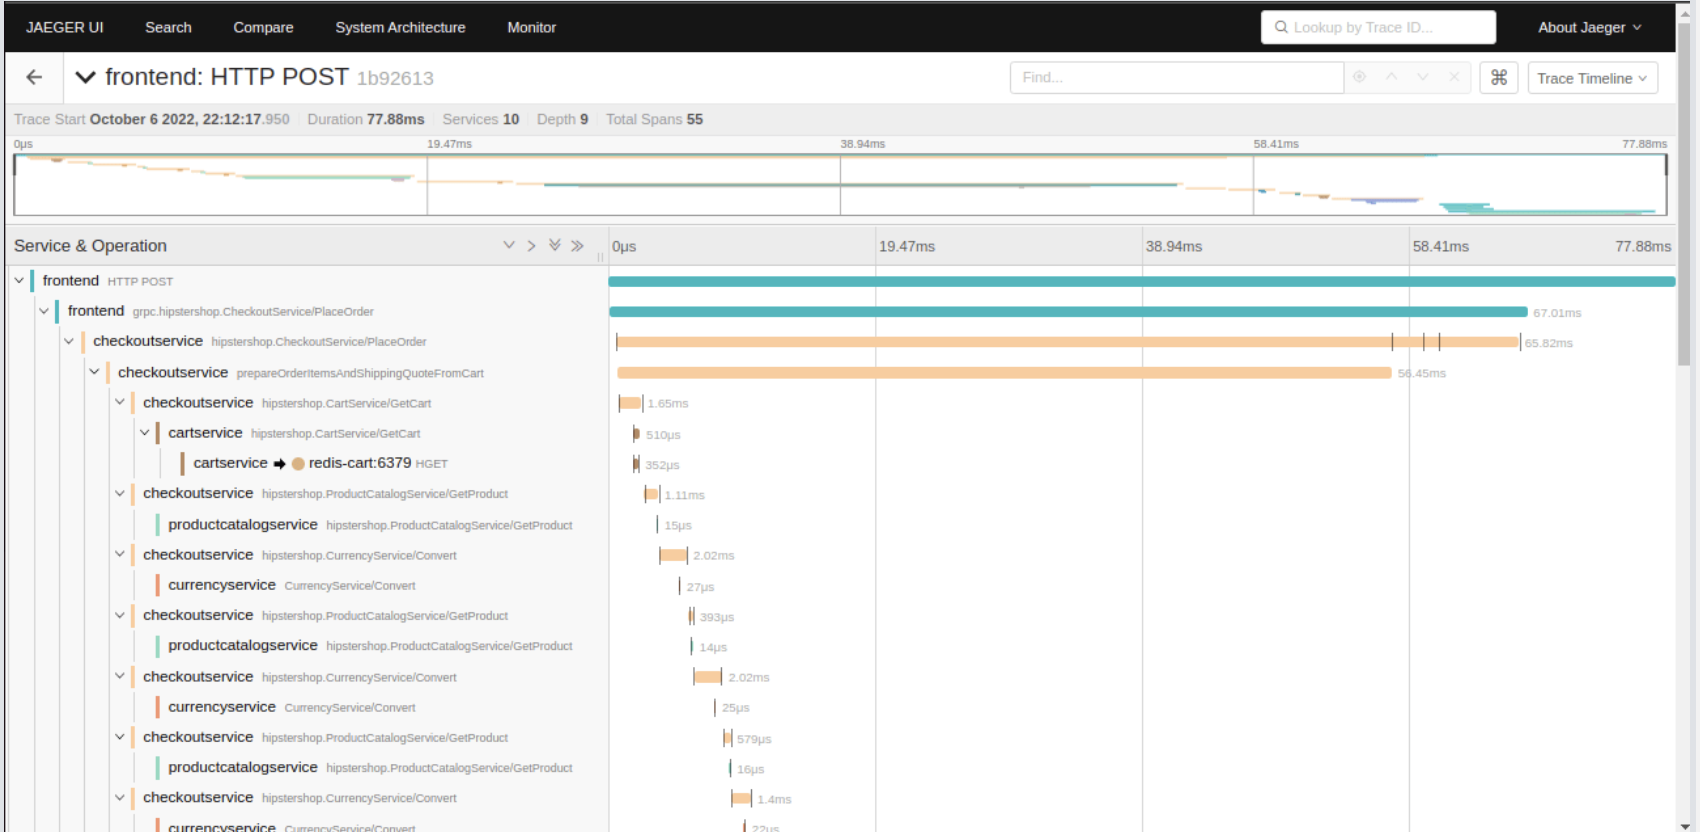
Although the demo app comes with Prometheus and Jaeger as backends to inspect the generated telemetry, doing so requires some knowledge of these tools before it can be useful. The more tools are added, the more opportunites there are for something to gone wrong. Maybe there was an update to the tool and the query you were using no longer works. Or maybe the container running the backend filled up its disk and crashed.
One topic discussed amongst contributors of the project at Kubecon Europe 2023, is the lack of a user interface out of the box for OpenTelemetry. Some of the concerns raised included:
- the need to always reference other projects or even vendors when demonstrating OpenTelemetry
- additional complexity and resources needed to show telemetry
- not having a hosted and easy to try solution for newcomers
Coincidenally, a few months ago, Amelia Ardath wrote a tool to render traces in a webapp, the OpenTelemetry Desktop Viewer.
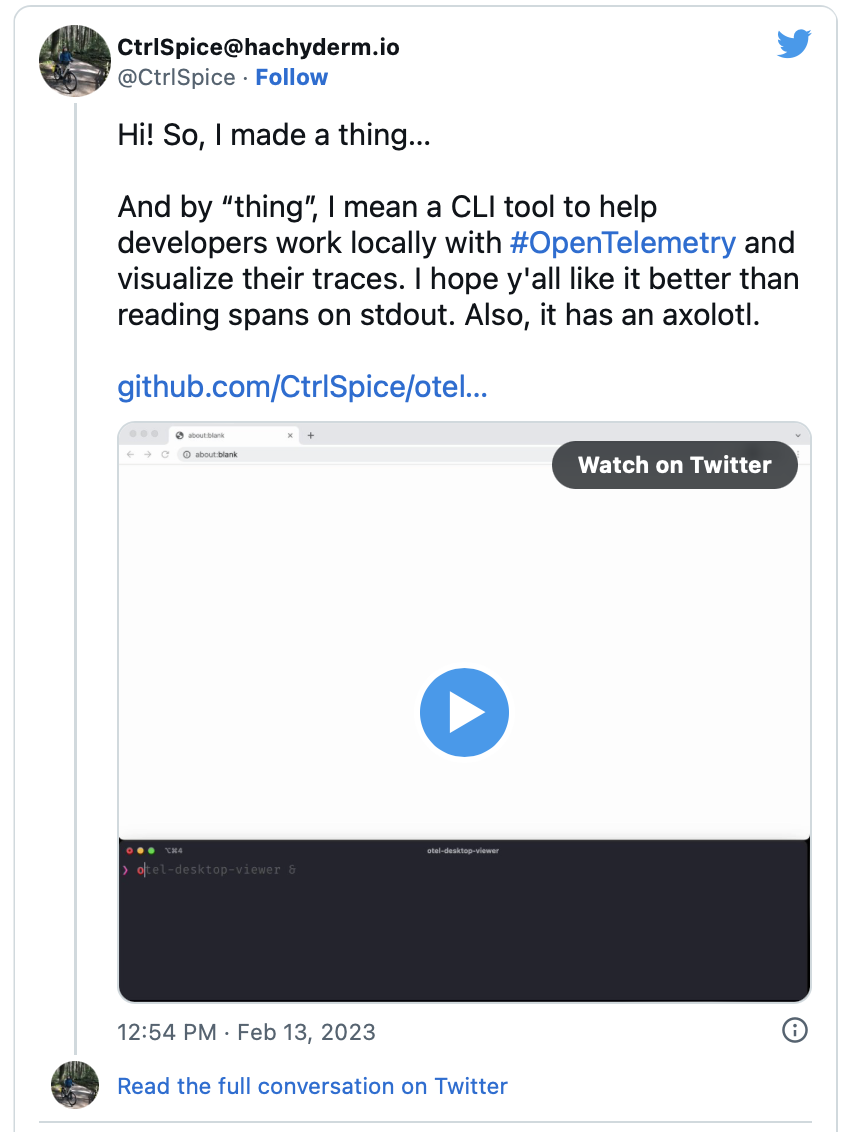
The OpenTelemetry Desktop Viewer is the perfect tool to become a user interface for OpenTelemetry. As a first step towards making this a reality, I wanted to try using Amelia’s OTel Viewer (https://github.com/CtrlSpice/otel-desktop-viewer) in a custom build of the OpenTelemetry Collector. This would allow anyone wanting to try it out to add it to their collector themselves. Additionally, making it a component that could be added to the collector would make adding it to the demo application a breeze.
Using the Collector builder, I produced a binary that includes the OTLP receiver and the desktop viewer exporter using the following manifest:
1
2
3
4
5
6
7
8
9
10
11
dist:
  otelcol_version: 0.75.0
  description: OpenTelemetry Collector with telemetry viewer
  name: otelcol

receivers:
  - gomod: go.opentelemetry.io/collector/receiver/otlpreceiver v0.75.0

exporters:
  - gomod: github.com/CtrlSpice/otel-desktop-viewer/desktopexporter v0.0.0-20230427050052-c878f5ca8151
  - gomod: go.opentelemetry.io/collector/exporter/otlpexporter v0.75.0
Once the custom collector is built, I packaged and published it in a Docker container. Running docker run -p0.0.0.0:4317:4317 -p0.0.0.0:8000:8000 codeboten/collector-with-viewer:latest will use that published image, and expose a local port for OTLP. The viewer will be available at http://localhost:8000.
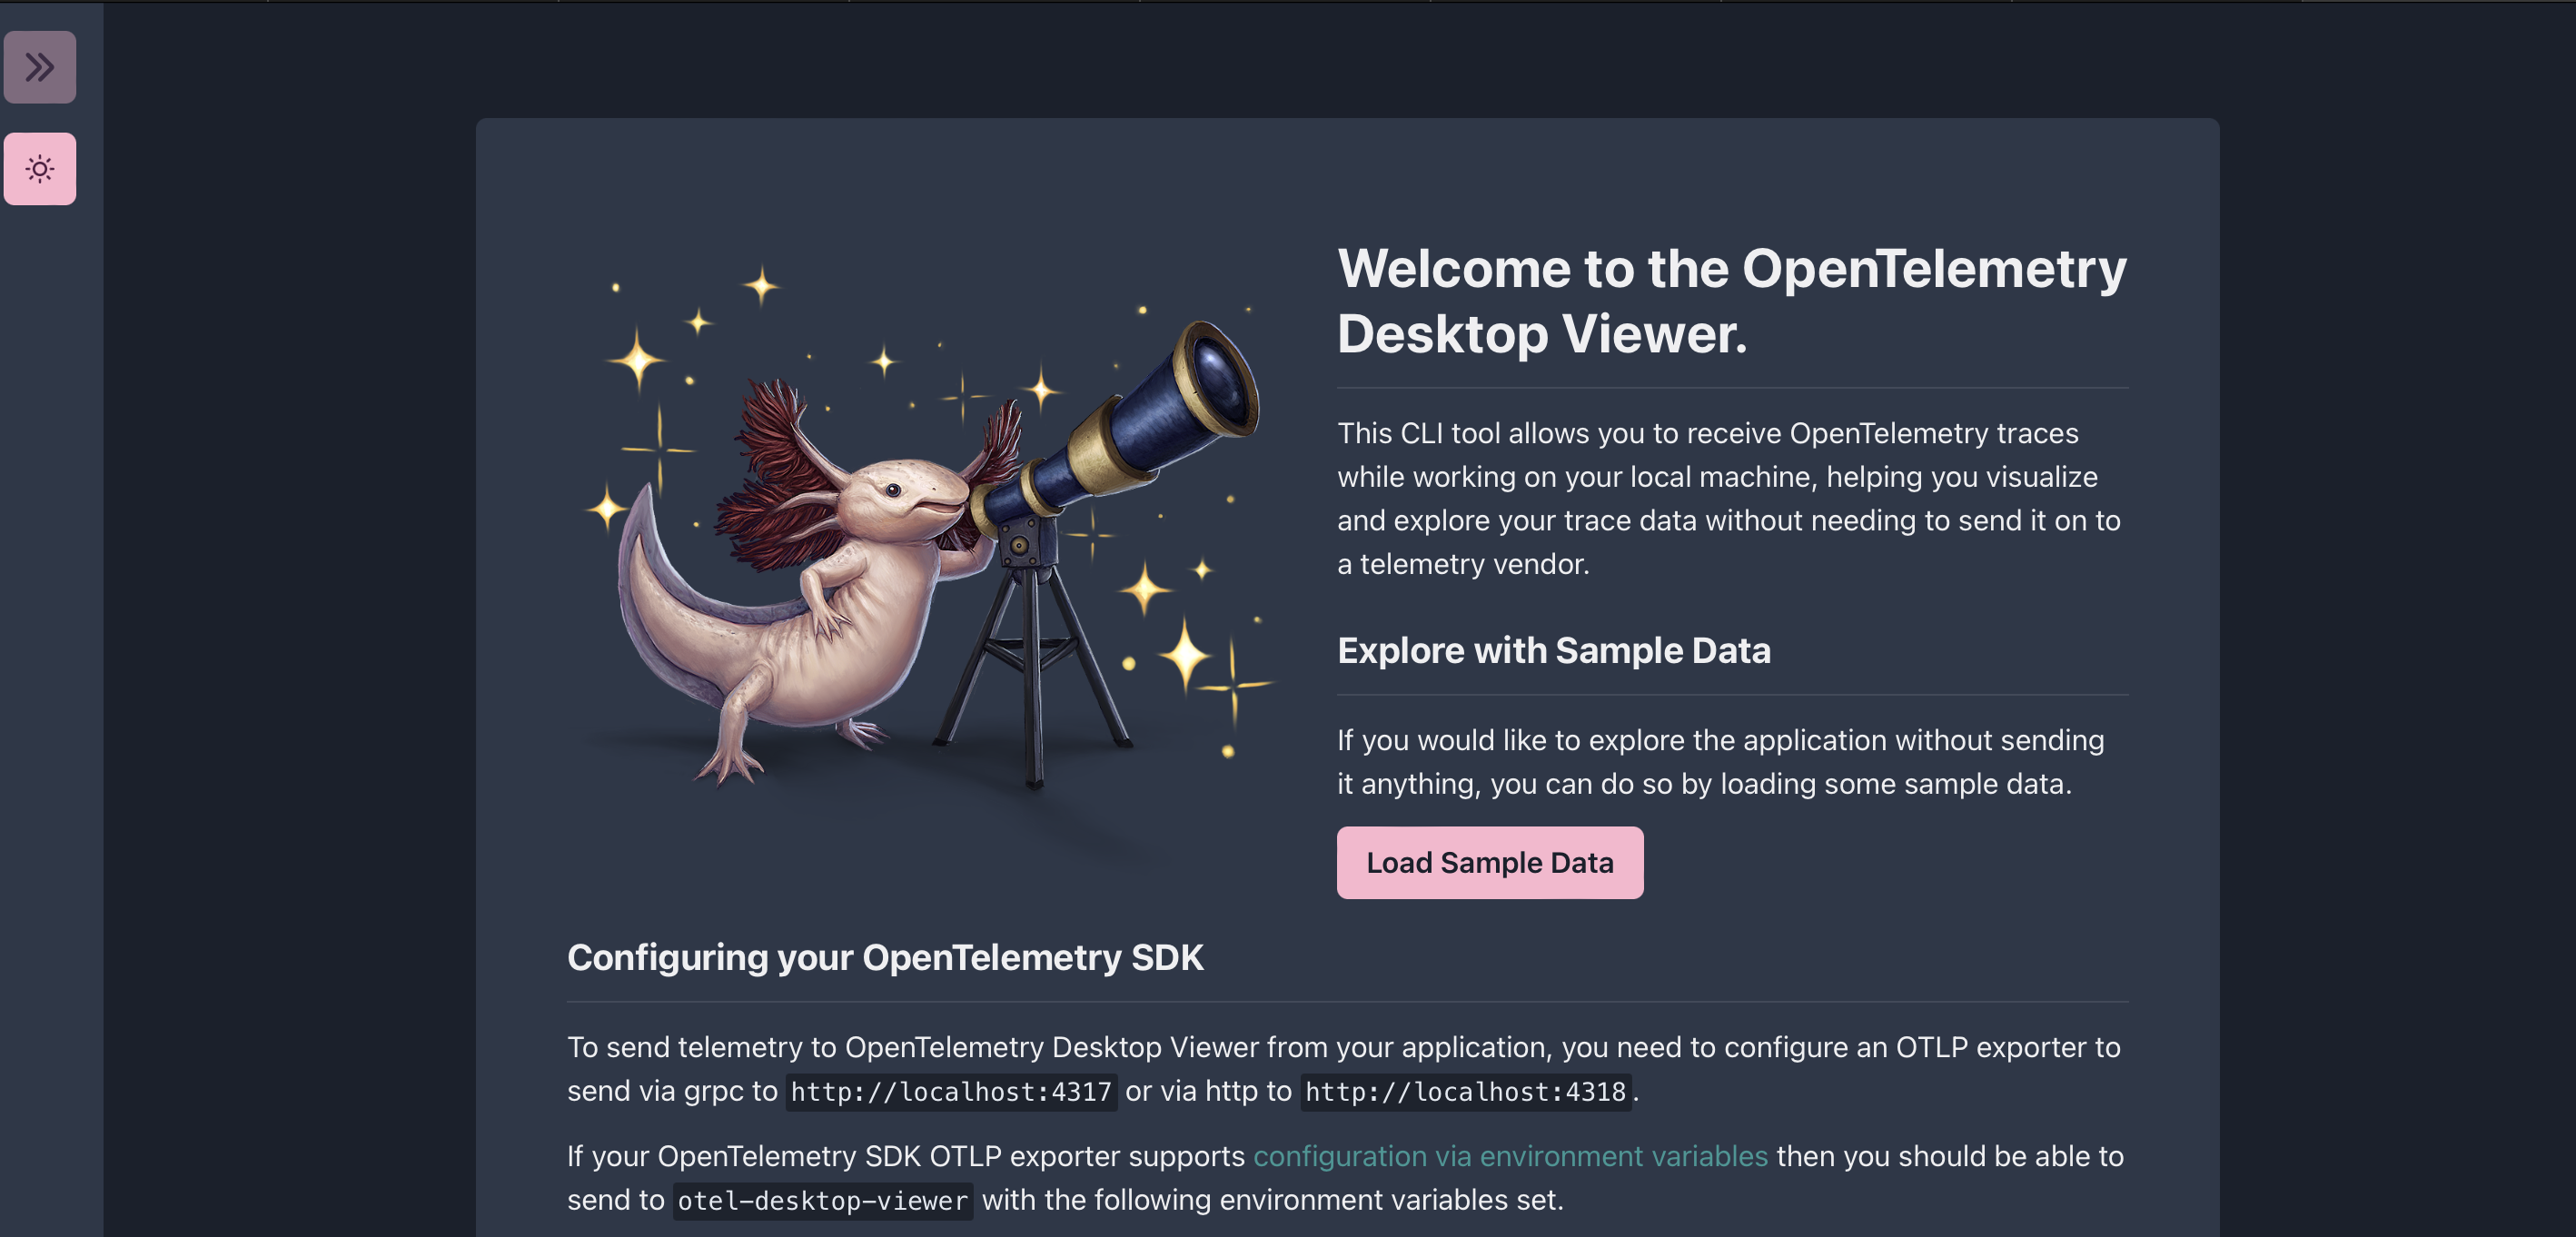
With the container running, the next step is to generate some data. If you’ve already got an application emitting OTLP, use that! Otherwise, the opentelemetry-collector-contrib repository contains a tool that will do just this: telemetrygen. After installing the tool, running telemetrygen traces --otlp-insecure will produce a single trace that will be exported using OTLP over gRPC to our custom collector et voila!
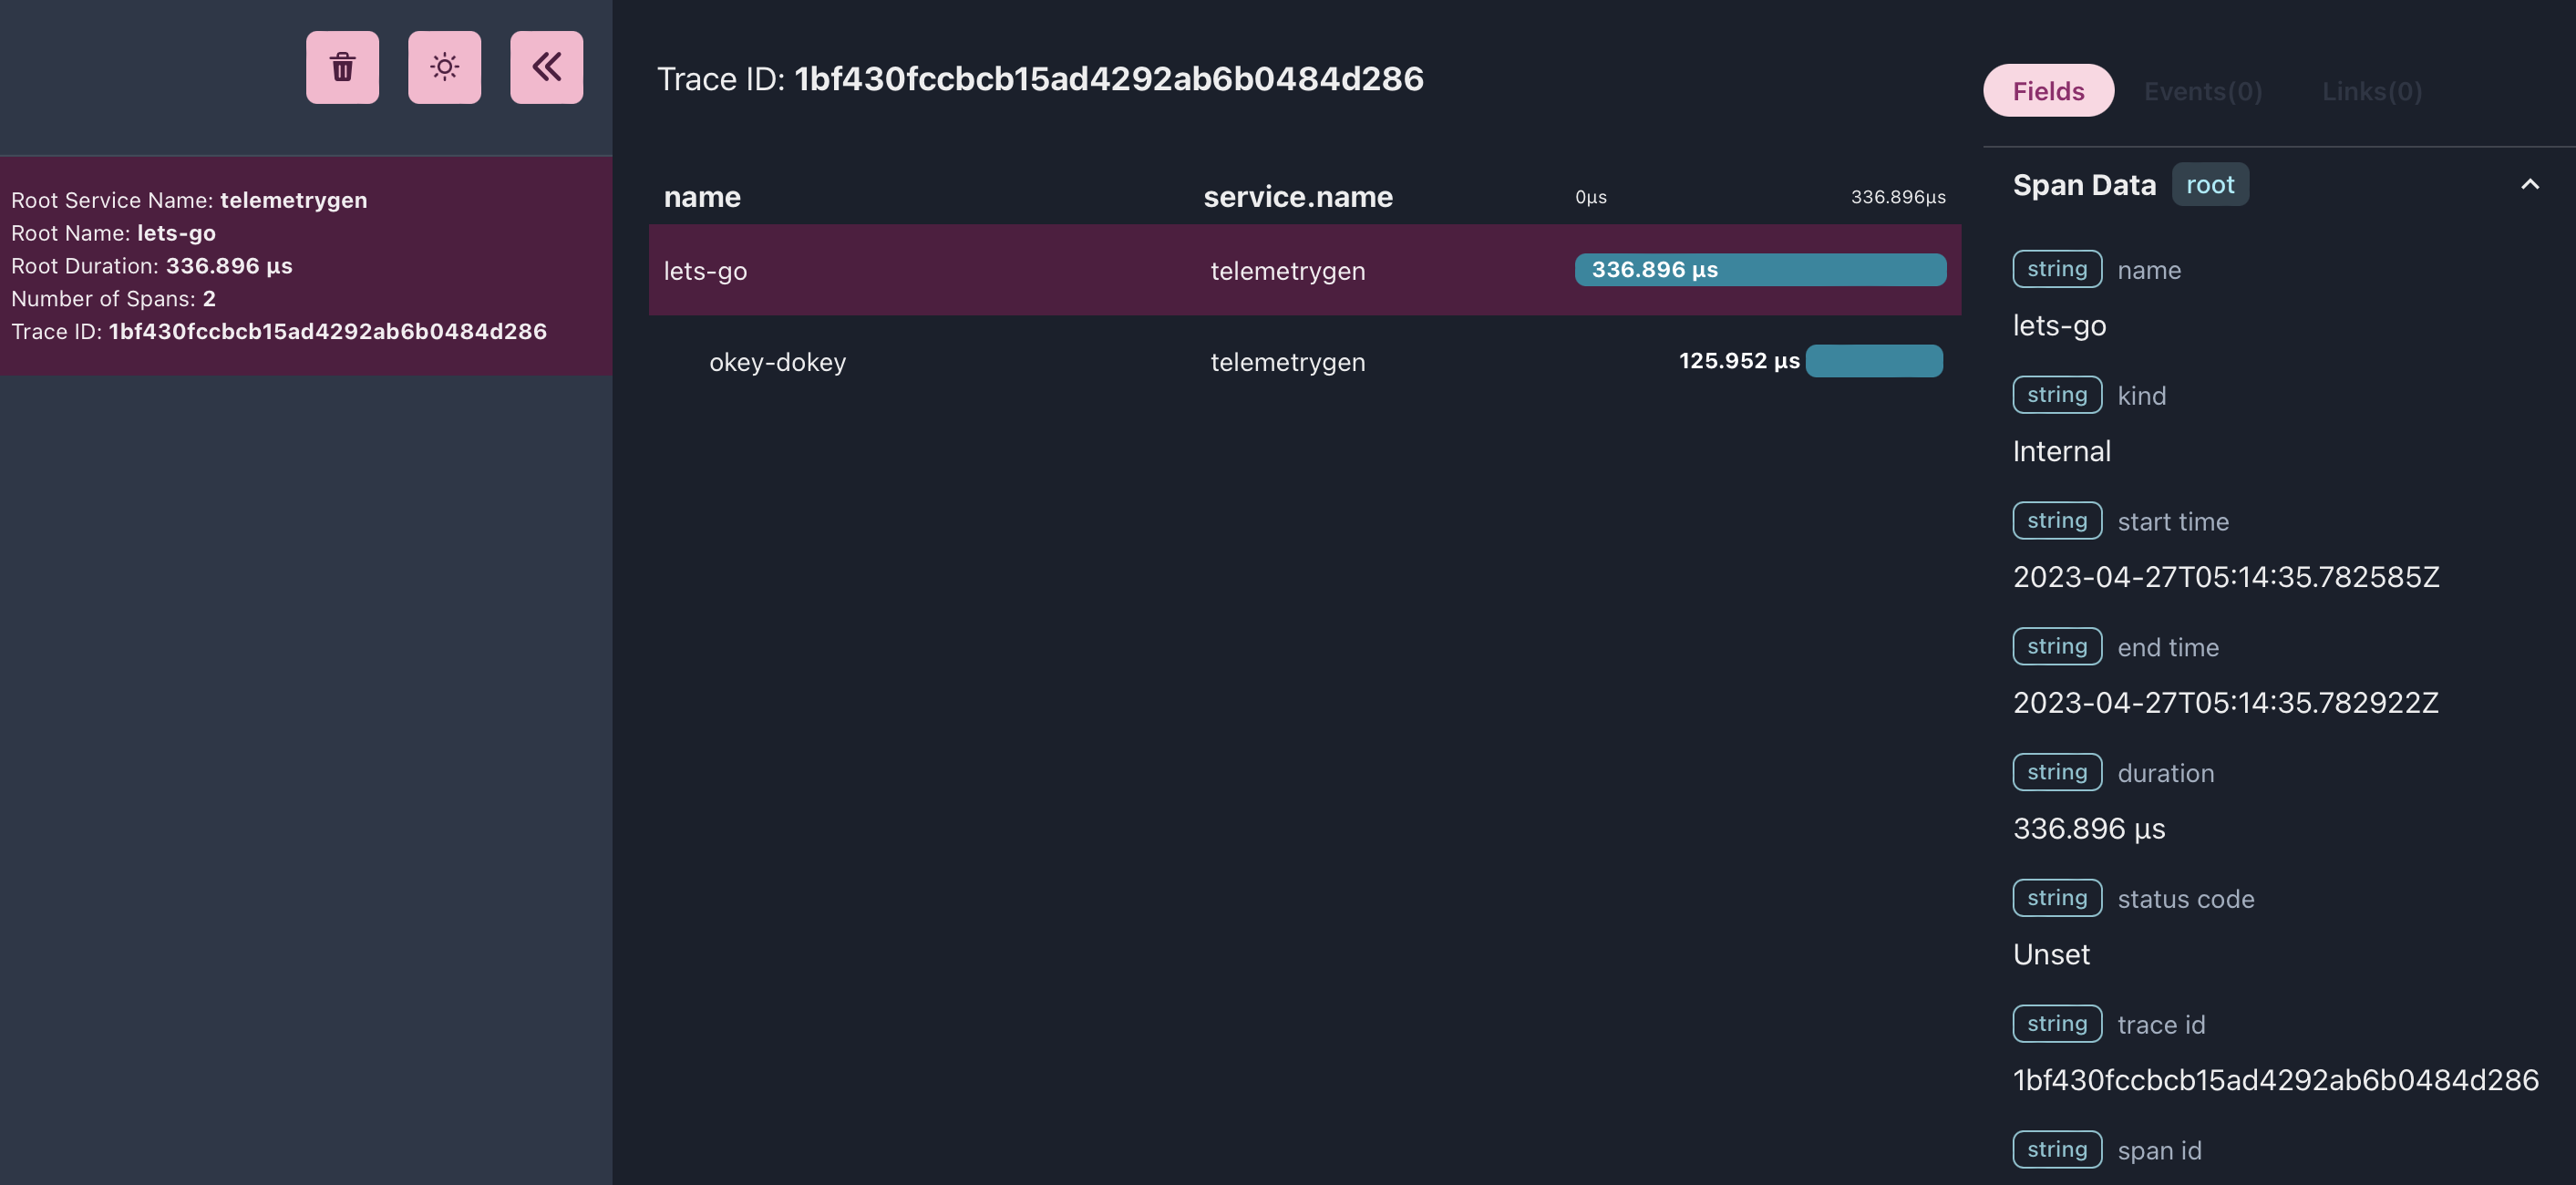
The trace is shown in the viewer, and we can explore the data through the web UI. Having a tool like this is really powerful for a few reasons:
- simplifies the experience for new comers
- gives people a way to explore the data that isn’t just reading the console output
- quickly tells us if data is going through the collector
The viewer already supports viewing trace data received by the OTLP receiver. Adding support for logs and metrics is next. After discussing it with the original author, there is interest in donating the OpenTelemetry Desktop Viewer to the OpenTelemetry project if there is support in the community. If you too think this is something you would find useful, comment on the repository or reach out over the internets!
