Understanding the OpenTelemetry Collector

The following is an excerpt of Cloud Native Observability with OpenTelemetry
So, now that we’ve learned how to use OpenTelemetry to generate traces, metrics, and logs, we want to do something with all this telemetry data. To make the most of this data, we will need to be able to store and visualize it because, let’s be honest – reading telemetry data from the console isn’t going to cut it. As we’ll discuss in Chapter 10, Configuring Backends, many destinations can be used for telemetry data. To send telemetry to a backend, the telemetry pipeline for metrics, traces, and logs needs to be configured to use an exporter that’s specific to that signal and the backend.
For example, if you wanted to send traces to Zipkin, metrics to Prometheus, and logs to Elasticsearch, each would need to be configured in the appropriate application code. Configuring this across dozens of services written in different languages adds to the complexity of managing the code. But now, imagine deciding that one of the backends must be changed because it no longer suits the needs of your business. Although it may not seem like a lot of work on a small scale, in a distributed system with applications that have been produced over many years by various engineers, the amount of effort to update, test, and deploy all that code could be quite significant, not to mention risky.
Wouldn’t it be great if there were a way to configure an exporter once, and then use only configuration files to modify the destination of the data? There is – it’s called OpenTelemetry Collector and this is what we’ll be exploring in this chapter.
In this chapter, we will cover the following topics:
- The purpose of OpenTelemetry Collector
- Understanding the components of OpenTelemetry Collector
- Transporting telemetry via OTLP
- Using OpenTelemetry Collector
The purpose of OpenTelemetry Collector
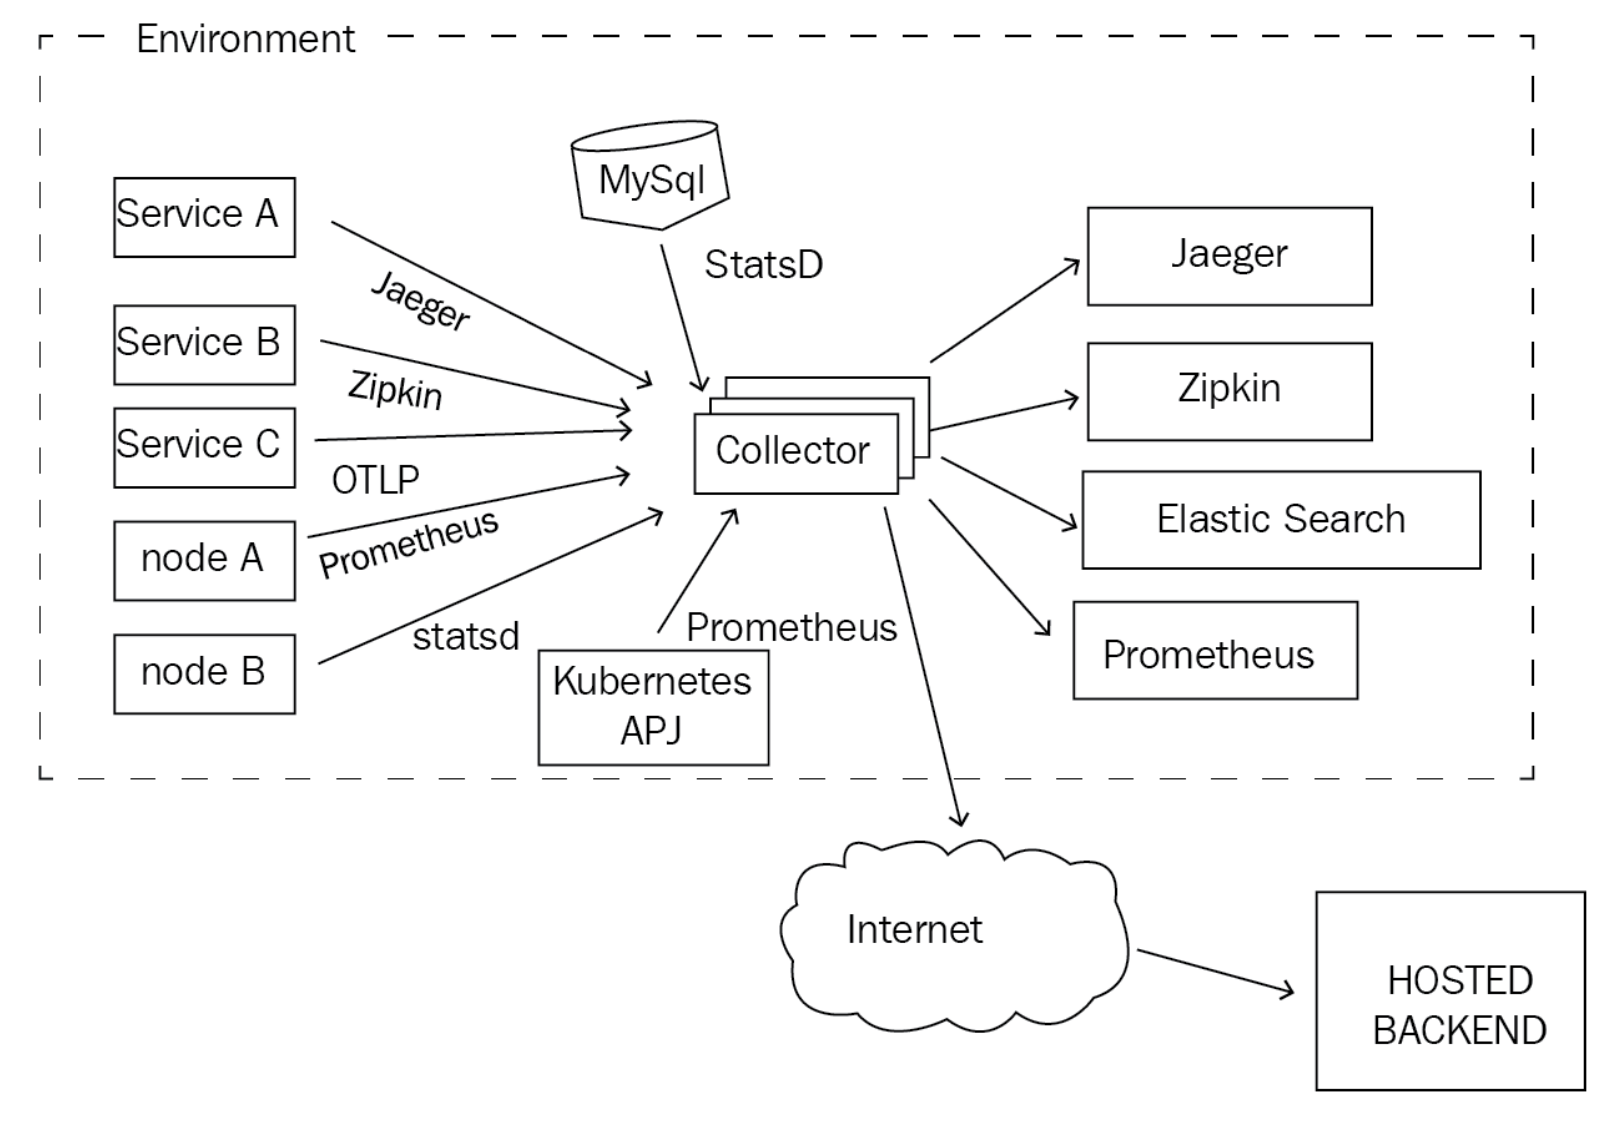
In essence, OpenTelemetry Collector is a process that receives telemetry in various formats, processes it, and then exports it to one or more destinations. The collector acts as a broker between the source of the telemetry, applications, or nodes, for example, and the backend that will ultimately store the data for analysis. The following diagram shows where the collector would be deployed in an environment containing various components:

Deploying a component such as OpenTelemetry Collector is not free as it requires additional resources to be spent on running, operating, and monitoring it. The following are some reasons why deploying a collector may be helpful:
- You can decouple the source of the telemetry data from its destination. This means that developers can configure a single destination for the telemetry data in application code and allow the operators of the collector to determine where that data will go as needed, without having to modify the existing code.
- You can provide a single destination for many data types. The collector can be configured to receive traces, metrics, and logs in many different formats, such as OTLP Jaeger, Zipkin, Prometheus, StatsD, and many more.
- You can reduce latency when sending data to a backend. This mitigates unexpected side effects from occurring when an event causes a backend to be unresponsive. A collector deployment can also be horizontally scaled to increase capacity as required.
- You can modify telemetry data to address compliance and security concerns. Data can be filtered by the collector via processors based on the criteria defined in the configuration. Doing so can stop data leakage and prevent information that shouldn’t be included in the telemetry data from ever being stored in a backend.
We will discuss deployment scenarios for the collector in Chapter 9, Deploying the Collector. For now, let’s focus on the architecture and components that provide the functionality of the collector.
Continue reading by getting your copy of Cloud Native Observability with OpenTelemetry on Packt or Amazon.